Wednesday, September 18, 2024

GNURadio Audio Sink Block For Windows Users


The GNURadio Audio Sink Block for Windows works well right out of the box. Here we’ll explore some things that don’t work as advertised as well.


GNURadio Audio Sink Block

Figure 1 shows the basic GNURadio Companion Audio Sink Block for Windows. The defaults will usually produce excellent results for most voice applications and some data applications.

 Figure 1 - GNURadio Audio Sink Block & Parameters


Parameters

ID - This is the name that will be used in the compiled Flowgraph. The ID can be changed to any valid Python name.

Sample Rate - A Dropdown box showing all the valid sample rates. Usually they are: 192k, 48k, 44.1k, 32k, 22.05k, 16k. where: 48k = 48,000 Killo Samples Per Second (KSPS). The Sample Rate can be any value from the drop down box or may be a valid variable name or python expression. For instance the field may be the Python expression: “samp_rate/decimation” as long as the variables samp_rate and decimation are declared elsewhere in the Flowgraph. More information below.

Device Name - If this field is blank, then the Windows Default Audio Output Device will be used. Otherwise this field is an Integer specifying which device to use, with “0” specifying the default device. More information below.

OK to Block - This allows the Audio Sink to apply “Back Pressure” or block the rest of the Flowgraph, thus acting like a Throttle. Usually this should just be left to “Yes”.

Num Inputs - An integer specifying the number of inputs to the block. Specifying “1” (Default) will be a Mono input that is delivered to both stereo speakers equally. “2” will specify two inputs that will map to the Stereo Left and Right outputs independently. Specifying a value greater than “2” will result in an error for most PC Sound Devices.


Sample Rate In Depth

For CW and voice communications demodulation that has an audio bandwidth of 6 kHz or less, setting the sample rate all the way down to 16 KSPS will work fine. When decoding low rate digital data such as VHF ACARS [1] the sample rate should be 48 or 192 KSPS so that there are enough samples for the decoder to work properly.

The ideal is to use an audio sample rate that is an integer divisor of the RF Sample Rate so decimations can be used exclusively instead of irrational resampling. For example: With a RF Sampling Rate of 2.4 MSPS, an overall Flowgraph decimation factor of 50 will result in an audio rate of 48 KSPS.

Note: I have noticed that on some Flowgraphs the lower sample rates sometimes get clicks in the audio. I assume that this is because there is some sort of interpolation going on in the device driver and it appears to be over or under-flowing the audio buffer. Just keep this in mind and test rigorously.


Device Name In Depth

The GNURadio 3.10 documentation (as of September 2024) states that a device's friendly name, as a string, can be used to specify the audio output device. Unfortunately, this is incorrect.

The GNURadio code actually uses the Windows C++ API WAVE_MAPPER functionality.

WAVE_MAPPER is a dynamic list of all the possible devices that can be used for Audio Input (Source) and Output (Sink) functionality.

For instance my Laptop by itself has one audio IO device, the inbuilt sound card. And the WAVE_MAPPER list will have only one entry for device “0”, or the default device.

When I connect my Laptop to my Docking Station, three other sound devices become available. The Docking Station has a Sound Card in it, the external Monitor connected to the docking station has a Sound Card in it, and finally the external Webcam also has a Sound Card in it. All these devices, when connected, cause the WAVE_MAPPER list to be reconfigured on the fly.

The Windows Sound Control Panel App allows a different default device to be reconfigured when the Laptop is standalone and when connected to my Docking Station. In my case, I have it configured to the Docks’ sound card that drives some external speakers when the Docking Station is connected.

WAVE_MAPPER device “0” is always the default device as configured by Windows. The other integer specifiers: 1, 2, and 3 in my case when connected to my Dock, can direct the audio to those devices. Unfortunately there is no direct way to tell which device is what hardware ID without writing some sort of utility to explore the WAVE_MAPPER list in real time.

But what you do know is that for any given configuration leaving the device name blank or putting a “0” there will always specify the Windows configured default device.

By trial and error, I found that my Laptops speakers were Device Name “1” when connected to my Docking Station. Hence if I use a Device Name of “1” when connected to my Docking Station I will be using the Laptops speakers. When I remove the Laptop from the Docking Station device “1” will not exist and the GNURadio code will fallback to the Windows WAVE_MAPPER default device, or in this case the Laptop Speakers.

This will work as long as no other sound devices are added or deleted to the system, as the WAVE_MAPPER may map the added or removed devices differently.

All you know for sure is that “0” is the Device Name for the default sound card.

If you specify a Device Name that does not exist, then the GNURadio code will fallback to the WAVE_MAPPER default device. Hence, you should always get some audio output on the default device. That’s a good thing.

A lot of Radio Sleuths use a “Virtual Audio Cable” to route the radios audio output to a virtual cable that can be sent to a software decoder. These Virtual Cables will also show up in the WAVE_MAPPER list.

Note: Check the console window in GNURadio Companion when running a Flowgraph, if there are any audio issues, a warning will be issued there.


Bonus

By running this command at a Windows command prompt you can get a list of the “MEDIA” or sound devices that are currently connected to your PC. It will list the "Friendly Name" but unfortunately won't tell you the current WAVE_MAPPER list mapping.

pnputil /enum-devices /class “MEDIA”


References

[1] ACARS is a low rate HF/VHF aircraft reporting system that  is popular to decode with SDR radios because the modulation bandwidth fits within a normal radios audio channel bandwidth - https://en.wikipedia.org/wiki/ACARS


Thursday, September 12, 2024

Documenting GNURadio Flowgraphs

Documentation is important in communicating to others any design intent, fortunately GNURadio Companion provides several features that make the task easier.


Block Comments & Notes

All GNURadio Blocks have a ‘Comments’ field. These comments show up under the blocks on the Flowgraph as shown in figure 1. Comments are very useful in documenting things such as filter parameters or other items of note, especially what variables are controlling. Comments are also useful in describing QT GUI Blocks and their functions or constraints. In general, Block Comments document what might otherwise be unclear from the Flowgraph itself.

There is also a generalized “Note” block that can be used independently of any other block to add documentation as and where it is needed.


Figure 1 - On the 'Advanced Tab' of each block is a 'Comment' field. Text that is written in the Comment will be displayed under the block. This is useful in capturing design and operation intent.


PDF Output

Screen grabs of anything but the smallest of Flowgraphs will be unsuitable for sharing because of the resolution loss. Fortunately GNURadio Companion has a very high resolution PDF Output. This output will make a PDF copy of your Flowgraph that can be zoomed in and out at will with any PDF reader and even on the Web and GitHub.

You can make a PDF of your Flowgraph via the main menu. Select: File -> Screen Capture and a file dialog will pop up asking where you want to save the generated PDF file.


GNURadio Flowgraph Itself

Unfortunately, the nature of the Blocks themselves makes some details hard to figure out unless the user has access to the actual Flowgraph file itself and can inspect every detail in GNURadio Companion. A Flowgraphs .grc file can be attached, emailed and uploaded to file servers like GitHub. The actual Flowgraph GRC file is in plain text.


Flowgraph Security

I am sure that there are ways to embed malicious Python code in a Flowgraph, but since the user base is so low, these are unlikely to be exploited. However, it is something to keep in mind and we should ensure that every Flowgraph is supplied with some sort of security hash for safety’s sake.

To help this, I have created a very simple SHA-256 hash generator in Python. It is freely available on GitHub [1].

To use the program PyHasher, simply run the Python 3 code. It will ask for a file to generate the hash from and then return with the SHA-256 has code that it generated.

This is useful both for sharing your Flowgraphs and for verifying any downloaded Flowgraph, as long as the author has supplied a suitable SHA-256 hash.

The second thing we should avoid is running GNURadio Companion with "Administrator Privileges", especially when running Windows. I have never had to do this with Radioconda [2], but I do have other design tools that require this to get around file access issues. Just don't do it here when you might get malicious Python code from some Flowgraph downloaded from the internet.

The third thing we should do is to inspect any Python Modules or Embedded Blocks to look for any code that does not have to do with GNURadio functions. Do this BEFORE running any downloaded Flowgraph, especially ones downloaded from random websites, and / or Google Drives or Dropbox's.

As they always say on the shop floor: "Safety First".


References

[1] Simple to use Hash Code Calculator in Python - https://github.com/Hagtronics/PyHasher

[2] Radioconda (recommend installer for Windows) -  https://github.com/ryanvolz/radioconda

Wednesday, September 11, 2024

Remove the extraneous markers (lines) from the GNURadio Frequency Sink & Vector Sink Blocks

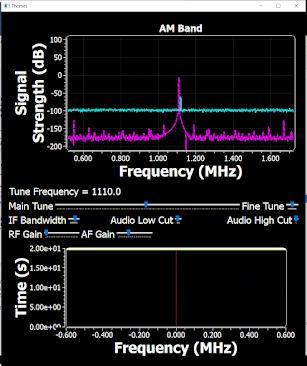
I am sure you have noticed the lines at the zero mark on the QT GUI Frequency Sink and QT Vector Sink Blocks in GNURadio (figure 1). These lines and can’t be changed directly in GNURadio Companion. Because of this, they are really just in the way most of the time.

In QT GUI terms these are called Markers and there are actually not one, but three lines or Markers on top of each other.

Figure 1 - The Frequency Sink and Vector Sink Blocks of GNURadio have these Lines or Markers at the zero point. They are sometimes very distracting, since we can't change them, all we can do with them it to remove them completely.


Solution

Since you can’t manipulate the Markers directly in GNU Radio Companion, which is a real shame, because they could be very useful, all we can do is to set them of OFF in a Theme QSS file.

I covered Theme QSS files in a previous post [1]. What I do here is to make a copy of the “plain.qss” file and call it something like: “my_plain.qss” file and add these lines to it,

FrequencyDisplayPlot {

qproperty-marker_lower_intensity_visible: false;

qproperty-marker_upper_intensity_visible: false;

qproperty-marker_noise_floor_amplitude_visible: false;

}


VectorDisplayPlot {

qproperty-marker_lower_intensity_visible: false;

qproperty-marker_upper_intensity_visible: false;

qproperty-marker_ref_level_visible: false;

}

Then set the theme for your Flowgraph, either globally or locally as per the previous post [1]. The Distracting Markers are now gone!

Someday, maybe the GNURadio maintainers will expose Marker functionality to us in GNURadio Companion. We can hope! :-)


References

[1] Post on GNU Radio Themes - https://gnuradio-cookbook.blogspot.com/2024/08/gnuradio-flowgraph-themes.html


Sunday, September 1, 2024

GNURadio Quantizer Implementation

This Embedded Python Block implements a Quantizer Function of a ADC or DAC like staircase output given a continuous input stream (figure 1). The block is most useful in demonstrating how a ADC or DAC quantizing action effects actual signals.

Figure 1 - Upper plot shows the quantizer transfer function for a 3 bit quantizer with the Vref = 1.0, the quantization step size is: 0.25 ( = (1.0 / 2**3) * 2 ). The upper trace will quantize like this for any signal from -Infinity to +Infinity because the Clipping flag is set to False.

The Lower plot shows the results for the same conditions except the Clipping flag is set to true. The clipping condition is described below.

Both Plots: The Blue trace is the input signal (block input) and the orange trace is the quantized representation of the input signal (block output)


Implementation

The Quantizer Block implements a model of a bipolar converter with the input centered on zero and the output that swings from (-Vref) to (Vref - 1 LSB)

The signal is quantized into Least Significant Bit (LSB) sized steps, where the LSB is equal to,

LSB = (Vref / 2**bits) * 2

For example, the LSB for an 8 bit quantizer with a Vref of 1.0 would be,

LSB = (1.0 / 256) * 2 = 0.0078

The heart of the implementation is the np.floor() function that is used to round the continuous input stream into a stepwise output.

np.floor(input_items[0]/vref*levels) / levels) * vref      (eq. 1)

Equation 1 by itself will quantize a signal based on the calculated LSB size, but won’t ever clip the output (see figure 1 upper). Optionally, you can use the blocks “clipping” flag to simulate an actual physical quantizer by clipping the output to the range (-Vref) to (Vref - 1 LSB) (see figure 1 lower). The clipping is implemented with the np.clip() function in the blocks code.


Usage / Test GRC Flowgraph

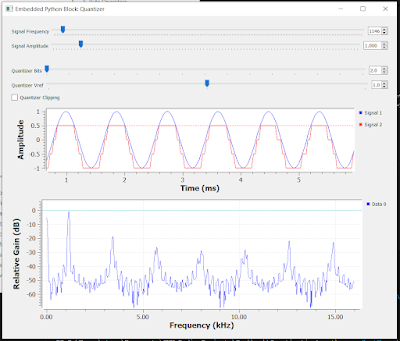
Embedded Python Blocks exist entirely within the Flowgraph, no other files are needed. An example Flowgraph is provided for download [2]. This Flowgraph simply implements a Sine Wave Source with adjustable Frequency and Amplitude that feeds the Quantizer Block. The parameters of the Quantizer Block are also fully adjustable via sliders. QT Time and Frequency sinks display the results of the quantizer action.

Figure 2 - The test Flowgraph provided [2] allows all the parameters to be adjusted that fully demonstrates the Quantizer Block functionality. Additionally a QT Time Sink shows the blocks input and output signals and the QT frequency Sink shows the blocks output spectral representation.


Using The Quantizer Block In Your Flowgraph

You can use the Quantizer block in a new Flowgraph by opening the test Flowgraph provided [2] and use the GNU Radio Companion copy and paste functions to paste the block into your new Flowgraph.

You could also wrap the Quantizer in a Hierarchical Block [3] then the Quantizer will show up in the GNURadio Companions blocks list.


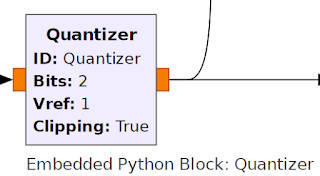
Figure 3 - As implemented, the Quantizer Block and the Blocks Properties.

The blocks properties are described below (these properties can all be changed at runtime),

Bits - Bits is the number of bits to quantize to, for example 8 Bits would quantize to 256 levels. Bits is an integer, and can be from 1 to any practical integer.

Vref - Vref is a float and sets the quantization step size and the limiting values for Clipping. Vref can be any value > 0

Clipping - Clipping is a Bool and sets whether clipping to the output signal is applied or not (see figure 1).

Block Signal Input and Output - This implementation is based on Float input and output signals.


Possible Experiments

Experiment 1 - With the Test Flowgraph provided [2], change the input frequency slider. Answer: Why does the QT Frequency Sink spectrum sometimes have a very low noise floor (with input signals that are exact multiples of the sampling rate) and at other frequencies the noise floor raises considerably? (Hint: This has to do with 'coherent' and 'non-coherent' sampling).

Experiment 2 - You can add noise to the input signal to simulate a Dithering signal. Dither applied like this randomizes the quantizer spurs and is commonly used in actual ADC circuits. Question: How much dither can be added before it starts to degrade the output signal?

Experiment 3 - Using an AM or FM radio receiver implementation, add the Quantizer Block to right before the audio sink.  Now, tuning to a weaker station, answer the question: How few number of bits can you get down to before the audio starts to sound raspy? Question 2: What happens when the Clipping flag is turned to True and the receiver is tuned to a strong station (i.e. the audio clips)?


References

[1] This Quantizer is based on this Stackexchange answer from “user49628” - https://electronics.stackexchange.com/questions/407685/is-there-a-simple-way-to-quantize-an-input-waveform-in-ltspice#407698

[2] Github Code Location - https://github.com/Hagtronics/gnuradio_cookbook/tree/main/quantizer

[3] GNURadio Hierarchical Block - https://wiki.gnuradio.org/index.php/Hier_Blocks_and_Parameters


Tuesday, August 27, 2024

GNURadio Flowgraph Properties Pages

 
Have you noticed that when you run a GNURadio Flowgraph and resize the QT GUI window, that on the next run of that Flowgraph the window returns to that last set size?

That’s commonly called a “Window Size Property”. programs have used a variety of methods of saving and recalling properties over the decades. QT, the base graphics GUI engine used in the GNURadio Flowgraphs is no different.

If you look at the Python program produced by a Flowgraph you will see right up at the top in the __init__() method a few lines of code as shown in figure 1.


Figure 1 - A generated Python Flowgraph file contains an __init__() method that contains these few lines that recall the last set window geometry, or size using standard QT method calls. The Base Key is named: "GNU Radio", the Flowgraph name in this case was called "themes_1", the property recalled is named: "geometry".


Where’s Waldo?

But where is this property called “geometry” saved? Usually, the directory “%APPDATA%” is used to save standard Windows properties, then it stores them in a folder named after the App, and finally, it saves the properties themselves in some file, such as an “INI” file.

Again, with GNURadio running on Windows [1], this resting place of the Properties is not in the standard Windows location and is rather hard to figure out.

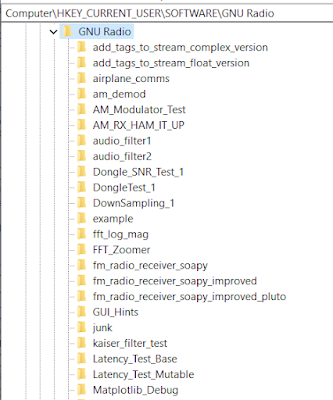
After searching the QT Documentation for the QSettings() method (for an hour), I found out that the default place to save the settings on Windows is in the Registry of all places (figure 2)!

Figure 2 - If you want to find the Flowgraph Properties Settings storage location, you will have to look into the registry. The path shows here, "HKEY_CURRENT_USER\Software\GNU Radio". There you see some of the many Flowgraphs that I have run. This list will be added to every time you run a Flowgraph with a new name!


What This Means

The registry will create a property Settings entry every time you run a Flowgraph with a new name to save the last set window size (geometry). You can’t do anything directly with this value as it is in binary and not human readable, but it is there.

If you are like me, where you make a lot of small Flowgraphs to just see how this or that block works, you will quickly end up with a lot of Registry entries.

You can delete the unused entries by hand, naturally, but this seems like a poor design decision (to me).

It is what it is, and at least you know where they are stored now.


References

[1] How to set an external code editor in GNURadio running Windows -https://gnuradio-cookbook.blogspot.com/2024/07/how-to-configure-external-editor-for.html


Friday, August 23, 2024

GNURadio Flowgraph Themes

Getting tired of the somewhat bland, bright white GNURadio Flowgraph GUI’s?

Did you know that you can change the runtime theme of GNURadio Flowgraphs? Read on to see how.


Basics

From the main GNURadio Companion menu select: Tools -> Set Default QT GUI Theme. Then a file picker will open with the four basic themes that are supplied with GNURadio (figure 1).

 Figure 1 - The four basic themes that are supplied with GNURadio. Also shown is the default path to the themes as installed by Radioconda on Windows [1].

Of the four themes, “plain.qss” is the basic bright white theme. The others are demonstrated below in figure 2.


alt.qss theme


dark.qss theme


projector.qss theme


Figure 2 - The three alternate themes that are supplied with GNURadio are demonstrated above.


Now For Something Completely Different

The alternatives to the standard GUI aren’t really all that compelling, are they?

Since QT is such a popular package and includes methods to change the theme easily, you can find other themes on the internet. One such repository is QSS Studio [2]. The QSS style sheets are similar to CSS format and are human readable ASCII text files.

After looking around the QSS Studio site, I found the interesting “adaptic.qss” theme. I downloaded the file, placed it with the other GNURadio default themes, chose it as the default, and figure 3 shows the results. It all works with no warnings or errors!

 Figure 3 - The QSS Studio Adaptic.qss theme is rather nice.


Theme Customization

The one thing that stands out to me from the adaptic theme is the FFT Trace colors. There are two ways to deal with this.

The First is: The trace colors can be overridden in the QT Frequency Sink widget itself.

The Second is: The qss theme file itself can be modified.

The QSS Studio files are naturally generic to all QT projects, whereas the GNURadio supplied QSS themes are more specific to GNURadio supplied widgets.

For instance, the GNURadio QT Frequency Sink widget is in a section called: “FrequencyDisplayPlot” in the GNURadio supplied QSS themes. You can copy that section and paste it to the end of any QSS Studio theme file. That way the Frequency Display Plot specific customization's can be overridden again when the theme is read in at runtime. By looking through these customization's, you can get an idea of what to change to modify the appearance of any specific GNURadio widget item.

You can comment out unused items or blocks of text in a qss file using old style C comments like,

/* comment in here */


Bonus

You can also set a "Per Flowgraph" theme in the Flowgraph Options Block as shown in figure 4. The only glitch in this is currently in GNURadio 3.10.10 the disalog box does not open up to the standard themes directory, but on my Windows system it opens to the Documents folder. No matter, the standard Themes location was discussed above, just navigate there.

Figure 4 - You can set a Theme for just the current Flowgraph by adding a link in the Flowgraphs Options Property Box as shown here.


Summary

It is very easy to get your own custom GNURadio runtime theme by going to QSS Studio or other sites for standard QT Themes and then just modifying those few items to bring the GNURadio specific items that may need tweaked.


References

[1] Radioconda Installer: https://github.com/ryanvolz/radioconda/

[2] QT Style Sheet References: https://qss-stock.devsecstudio.com/


Saturday, August 17, 2024

Overview of FIR Filter Blocks & Usage in GNURadio

GNURadio provides several wrapper functions to take the pain out of Finite Impulse Response (FIR) Filter design, but some background information is required to fully understand what is going on behind the scenes and to use the wrapper functions to their full potential.

In this brief review, we will talk about Low Pass Filters, but the discussion is applicable to all the supported filter types: Low Pass, High Pass, Band Pass, Band Reject.


Filter Design Parameters

To design a filter, you first need the design parameters or goals. Figure 1 shows a basic filter response and the usual goals.

Figure 1 - To design a filter, you first need a set of design goals, then you can fit the minimum complexity filter to the goals. Above are the GNURadio Standard Definitions for a FIR Filter.

Sometimes the filter terms are different, such as a “Shape Factor” will be specified instead of a “Transition Band” but these terms may be expressed as any other term to fit the above GNURadio standard definitions.


GNURadio FIR Filter Design Methodology

There are a multitude of ways to design FIR Filters, GNURadio uses the Window Function methodology which bases the filter response on a supplied Window function. The Window functions are the same ones used in windowing data before a FFT, because they are well known and understood [1][2]. 


GNURadio's Convenience Filter Blocks

If you look at the Blocks -> Core -> Filters in GNURadio Companion you will see these basic filter types listed,

Low Pass Filter

High Pass Filter

Band Pass Filter

Band Reject Filter

These are the simplest and easiest filters to get going quickly in a flowgraph. They implement a wrapper function around the low level “Decimating FIR Filter” block. These simplified filters are decimating as that is the most commonly used functionality with GNURadio. If a Decimation is specified, first your signal is filtered by your specified filter parameters, then the signal is decimated. Be sure your filter adequately filters the input signal to a bandwidth that is less than the resulting decimated sample rate to eliminate spurious out-of-band signals. If decimation is not required, just set it to 1 and no decimation will be done on the output stream.

The convenience filter blocks have all the parameters needed to design a decent filter included in the block definition (Figure 2).

Figure 2 - The Low Pass Filter Block Parameter. The Frequencies are in Hz, the Window type and Beta is described later. For general defaults they are fine lest as is.

However, you might notice one filter parameter that is shown in figure 1 that appears to be missing, namely the: “Stop Band Attenuation”. The Stop Band Attenuation is not missing, but it has been “wrapped away” for simplicity. The trouble is that the implicit Stop Band Attenuation that is used for any given window is hidden deep in the GNURadio API documentation. Figure 3 shows what the Documentation has to say about this.


Figure 3 - The upper figure is the API documentation for the max_attenuation() function. The bottom figure contains specific detail on the GNURadio windows.

In the code when these wrapper functions are used, a function named max_attenuation() is called and given the specified window type (figure 3 upper).

This function then looks at an enumeration called win_type to retrieve the default stop band attenuation values (figure 3 lower).

The specific window data is the missing piece of the puzzle. Out of the window types shown in figure 3 lower, for these wrapped filter functions you can choose four standard windows (figure 4), with the given stop band attenuation.

  • Hamming - Stopband Attenuation is: 53 dB
  • Hann - Stopband Attenuation is: 44 dB
  • Blackman - Stopband Attenuation is: 74 dB
  • Rectangular - Stopband Attenuation is: 21 dB
  • Kaiser -  
If Beta = 4.55, Stopband Attenuation is: 50 dB
If Beta = 6.76, Stopband Attenuation is: 70 dB
 
For other stopband attenuations greater than 50 dB, you can calculate a Beta based on the following formula,
Beta = 0.1102 * ( stopband_attenuation_dB - 8.7 )

Figure 4 - The basic filter block provides 4 widow types. The Kaiser window is adjustable using the Beta factor as described later.

The default Hamming Window is a good choice for most over the air demodulation tasks and RTL based receiver USB sticks.. Rarely will you ever have a signal-to-noise ratio that is so large that 53 dB attenuation is insufficient. If you want some more optimization, then the Kaiser window offers it. A 90 dB attenuation filter can be specified by using a Kaiser Window with a Beta equal to 8.96.


Frequency Translation Filter

The Frequency Translation Filter (FTF) or, Channelizing filter is a very common filter in SDR design (figure 5, and reference 3). It allows a portion of the sampled RF bandwidth to be selected and brought down to baseband for further processing.


Figure 5 - Frequency Translating Filter, or Channelizer. This block does not have filter parameter specifications directly, but rather has a field called 'Taps' that expects a list of FIR filter taps.

As shown in Figure 5, the FTF filter lacks any sort of filter definitions but instead has a field called ‘Taps’. In this field, there needs to be a list of filter taps that define the FIR filter. Don’t fret, GNURadio provides another set of wrapper blocks that provide the required list for you (figure 6). 


Figure 6 - GNURadio provides various 'Taps' blocks. These blocks are a wrapper around an even lower level call to a C++ function that is described below. The 'Filter Taps Loader' is a special block that can read filter Taps from a text file.

Typically, the FTF filter consists of two types: a Complex Bandpass filter for Complex IO, and a Real Low Pass Filter for Real IO. Figure 7 shows the familiar filter specification fields as the other filters. 

Figure 7 - The parameters for a given Taps block. Since this block is a bandpass filter the specifications are slightly different than for a low pass filter because you can specify the low and high cutoff frequencies independently.

All that needs to be done to use the Taps Filter Block is, give the Filter Taps Block some ID name (or use the default), then paste this same name in the ‘Taps’ field of the FTF block as shown in figure 8.

 Figure 8 - To use any of the Filter Taps Blocks, be sure to give it a name and paste that same name in the Filter Block 'Taps' field as shown above.


Base Filter Functions

Below these Taps wrapper blocks are a series of functions called firdes.xxxx() as shown in figure 9.

firdes.band_pass(), firdes.band_pass_2()

firdes.band_reject(), firdes.band_reject2()

firdes.complex_band_pass(), firdes.complex_band_pass_2()

firdes.complex_band_reject(), firdes.complex_band_reject_2()

firdes.gaussian() 

firdes.high_pass()

firdes.high_pass()

firdes.hilbert()

firdes.low_pass(), firdes.low_pass2()

firdes.root_raised_cosine()

Figure 9 - firdes() functions available. These functions take various parameters and produce a list of taps. These functions may be directly inserted in the "Taps" field of any block.

You can use the appropriate firdes functions in any Taps field and the proper taps will be generated at runtime. The firdes functions take various parameters which describe the filter just like the filter blocks as described above. You can access the current documentation by clicking on the reference 4 links below.

To use a firdes function you can fill in the proper fields [4] the paste the function call directly in the 'Taps' field. A definition that has the same functionality as the Taps Block in figure 8 is shown below,

firdes.complex_band_pass(1, samp_rate, -5000, 5000, 500, window.win_type.WIN_HAMMING, 6.76)

Using Raw Taps Lists

You can also use a raw Python list of Taps in any Taps field. These taps may be generated by any suitable FIR filter design program, such as the GNU Radio Supplied Filter Design Tool.

Note: As of GNURadio version 3.10.10, the Filter Design Tool is not properly working for Kaiser Window based filters. Specifically, it is incorrectly calculating the attenuation based on the GUI input value.

To use the Filter Design Tool, simply enter your desired parameters, press the "Design” button and inspect the results.

The Filter Designer GUI has a “Filter Coefficients” tab, there you can cut and directly paste the list into the “Taps” field of the GNU Radio Block.

taps=0.015155321023725285,0.027219656578798622,

0.029870991728012164,0.01184698593945574,-0.021991794902241332,

-0.05036266878604228,-0.05031691165541314,-0.018823427291265682,

0.018756485040462168,0.026013593755063666

The above text shows the Example Filter Coefficients cut directly from the Filter Designer GUI “Filter Coefficients” tab.

[0.015155321023725285,0.027219656578798622,0.029870991728012164,

0.01184698593945574,-0.021991794902241332,-0.05036266878604228,

-0.05031691165541314,-0.018823427291265682,0.018756485040462168,

0.026013593755063666]

Before Pasting the raw filter coefficients in any ‘Taps’ field, first remove the leading "taps = " text, then surround the entire list with the Python notation for a list, namely square brackets: [] as shown in the lower text example above. This modified text can then be inserted into the Taps field of any filter type that offers it.

Note: FIR Filter Taps usually consist of fifty to sometimes hundreds of coefficients, not the few shown above for simplicity.


Bonus

If you want to visualize your filter in GNURadio, you can use the 'Cookbook Idea' presented here,

https://gnuradio-cookbook.blogspot.com/2024/08/using-gnuradio-companion-to-visualize.html


References

[1] Window Reference Information: https://en.wikipedia.org/wiki/Window_function

[2] List of GNU Radio Windows: https://www.gnuradio.org/doc/doxygen/classgr_1_1fft_1_1window.html

[3] Frequency Translating Filter GNURadio documentation: https://wiki.gnuradio.org/index.php/Frequency_Xlating_FIR_Filter/

[4] firdes API Documentation: https://www.gnuradio.org/doc/doxygen/classgr_1_1filter_1_1firdes.html

firdes Github Code Repository: https://github.com/gnuradio/gnuradio/blob/main/gr-filter/lib/firdes.cc