This Embedded Python Block implements a Quantizer Function of a ADC or DAC like staircase output given a continuous input stream (figure 1). The block is most useful in demonstrating how a ADC or DAC quantizing action effects actual signals.
Figure 1 - Upper plot shows the quantizer transfer function for a 3 bit quantizer with the Vref = 1.0, the quantization step size is: 0.25 ( = (1.0 / 2**3) * 2 ). The upper trace will quantize like this for any signal from -Infinity to +Infinity because the Clipping flag is set to False.
The Lower plot shows the results for the same conditions except the Clipping flag is set to true. The clipping condition is described below.
Both Plots: The Blue trace is the input signal (block input) and the orange trace is the quantized representation of the input signal (block output)
Implementation
The Quantizer Block implements a model of a bipolar converter with the input centered on zero and the output that swings from (-Vref) to (Vref - 1 LSB)
The signal is quantized into Least Significant Bit (LSB) sized steps, where the LSB is equal to,
LSB = (Vref / 2**bits) * 2
For example, the LSB for an 8 bit quantizer with a Vref of 1.0 would be,
LSB = (1.0 / 256) * 2 = 0.0078
The heart of the implementation is the np.floor() function that is used to round the continuous input stream into a stepwise output.
np.floor(input_items[0]/vref*levels) / levels) * vref (eq. 1)
Equation 1 by itself will quantize a signal based on the calculated LSB size, but won’t ever clip the output (see figure 1 upper). Optionally, you can use the blocks “clipping” flag to simulate an actual physical quantizer by clipping the output to the range (-Vref) to (Vref - 1 LSB) (see figure 1 lower). The clipping is implemented with the np.clip() function in the blocks code.
Usage / Test GRC Flowgraph
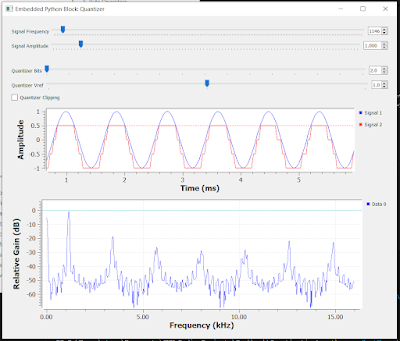
Embedded Python Blocks exist entirely within the Flowgraph, no other files are needed. An example Flowgraph is provided for download [2]. This Flowgraph simply implements a Sine Wave Source with adjustable Frequency and Amplitude that feeds the Quantizer Block. The parameters of the Quantizer Block are also fully adjustable via sliders. QT Time and Frequency sinks display the results of the quantizer action.
Figure 2 - The test Flowgraph provided [2] allows all the parameters to be adjusted that fully demonstrates the Quantizer Block functionality. Additionally a QT Time Sink shows the blocks input and output signals and the QT frequency Sink shows the blocks output spectral representation.
Using The Quantizer Block In Your Flowgraph
You can use the Quantizer block in a new Flowgraph by opening the test Flowgraph provided [2] and use the GNU Radio Companion copy and paste functions to paste the block into your new Flowgraph.
You could also wrap the Quantizer in a Hierarchical Block [3] then the Quantizer will show up in the GNURadio Companions blocks list.
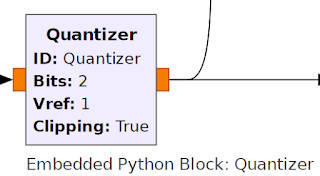
Figure 3 - As implemented, the Quantizer Block and the Blocks Properties.
The blocks properties are described below (these properties can all be changed at runtime),
Bits - Bits is the number of bits to quantize to, for example 8 Bits would quantize to 256 levels. Bits is an integer, and can be from 1 to any practical integer.
Vref - Vref is a float and sets the quantization step size and the limiting values for Clipping. Vref can be any value > 0
Clipping - Clipping is a Bool and sets whether clipping to the output signal is applied or not (see figure 1).
Block Signal Input and Output - This implementation is based on Float input and output signals.
Possible Experiments
Experiment 1 - With the Test Flowgraph provided [2], change the input frequency slider. Answer: Why does the QT Frequency Sink spectrum sometimes have a very low noise floor (with input signals that are exact multiples of the sampling rate) and at other frequencies the noise floor raises considerably? (Hint: This has to do with 'coherent' and 'non-coherent' sampling).
Experiment 2 - You can add noise to the input signal to simulate a Dithering signal. Dither applied like this randomizes the quantizer spurs and is commonly used in actual ADC circuits. Question: How much dither can be added before it starts to degrade the output signal?
Experiment 3 - Using an AM or FM radio receiver implementation, add the Quantizer Block to right before the audio sink. Now, tuning to a weaker station, answer the question: How few number of bits can you get down to before the audio starts to sound raspy? Question 2: What happens when the Clipping flag is turned to True and the receiver is tuned to a strong station (i.e. the audio clips)?
References
[1] This Quantizer is based on this Stackexchange answer from “user49628” - https://electronics.stackexchange.com/questions/407685/is-there-a-simple-way-to-quantize-an-input-waveform-in-ltspice#407698
[2] Github Code Location - https://github.com/Hagtronics/gnuradio_cookbook/tree/main/quantizer
[3] GNURadio Hierarchical Block - https://wiki.gnuradio.org/index.php/Hier_Blocks_and_Parameters


No comments:
Post a Comment